Data shows that, among 10 major cities, the volume of online conversations about tourism has increased by an average of 40%.
This past year, our team working on Tourism Sentiment Index (TSI) has crunched enormous amounts of data – more than a billion online conversations about 420+ tourism destinations.
TSI solves a fundamental problem for destination marketers by telling them how people feel about their tourism destinations – not what people would say in a survey, not what they might tell their friends, but the sentiment they express publicly about specific tourism assets.
Our analysis of TSI’s detailed collection of data reveals how places are perceived and how that changes over time. On a macro level, each new report adds another piece to the mosaic that is beginning to show worldwide trends. Our TSI team is well on its way to setting a global benchmark using data from 1,000 destinations. (See our first snapshot here.)
As we deliver reports to more and more DMOs of all sizes, we’re noting some interesting performance patterns.
To show one example of these patterns, we’ve isolated data from 10 U.S. destinations to rank their performance over time. Let’s look at who came out ahead and what this means for your destination.
10 U.S. cities ranked: Year-over-year growth in tourism conversation volume
These 10 large, U.S. cities are distributed across the country geographically. Each has unique strengths and weaknesses, and the data tells us how word of mouth is changing.
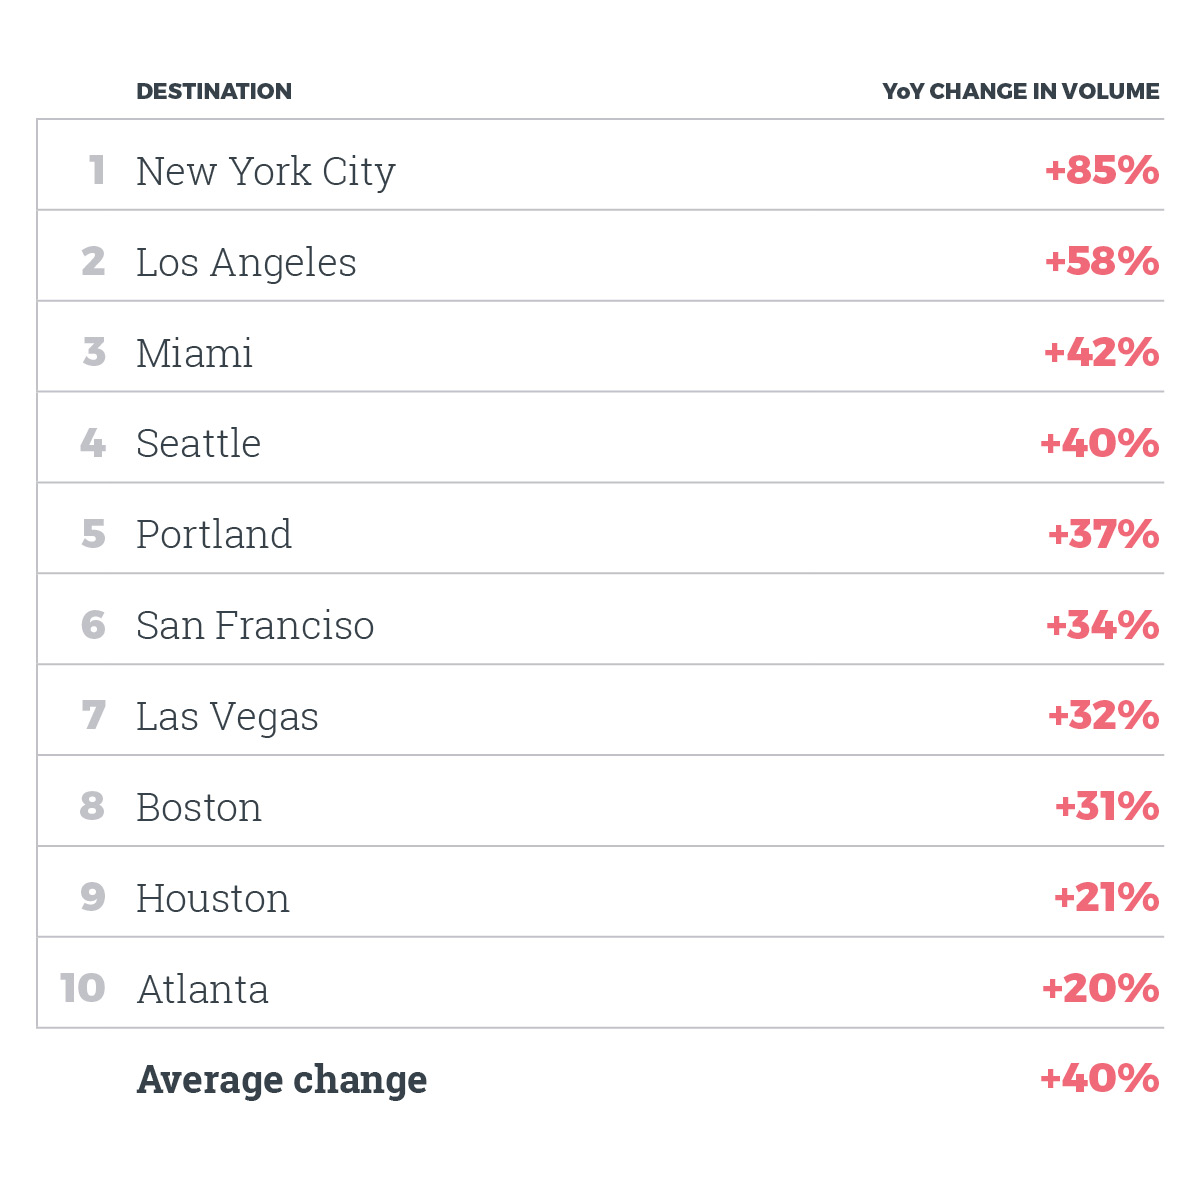
The table above shows the growth in online tourism conversation volume, year-over-year (YOY), from 2017 to 2018. Essentially, this metric measures the increase in online conversations about tourism related to each city. Click to read more about how TSI works and what it measures.
New York City is the clear winner with a whopping 85% YOY increase. It’s also stunning to see average growth of 40% in online word of mouth across these 10 cities.
Which tourism assets are growing the fastest?
TSI measures word of mouth for 50 types of tourism assets in each destination. Among the 10 cities, these five had the highest increases in volume between 2017 and 2018.
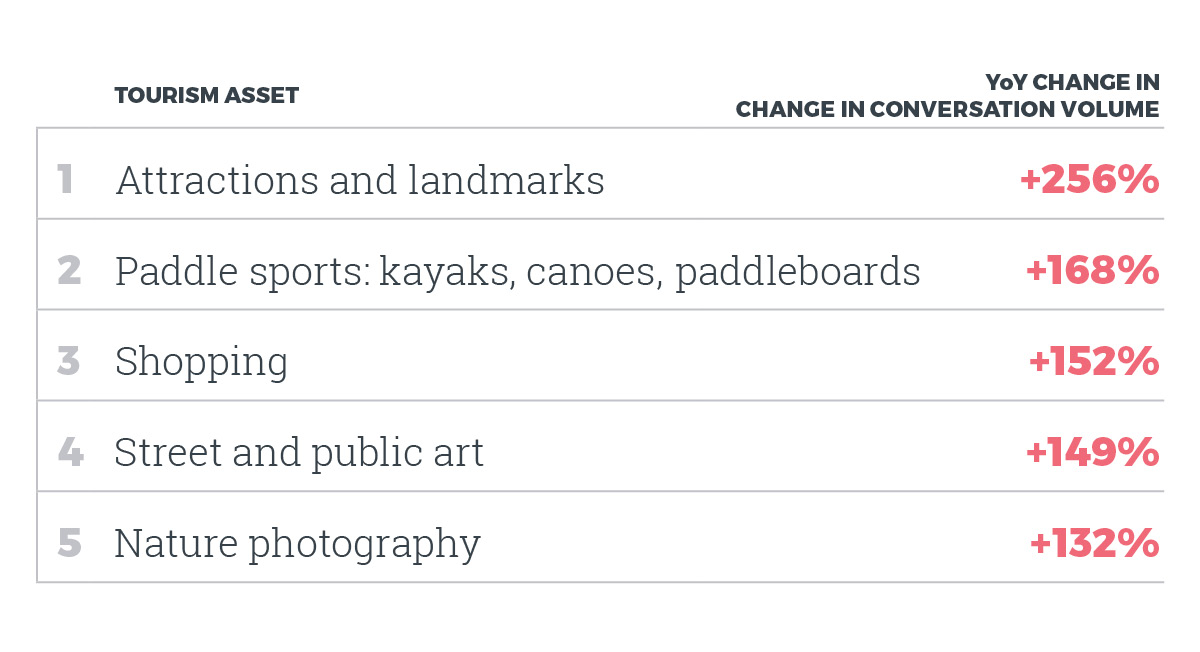
These five tourism assets are growing the fastest out of the 50 assets measured.
10 U.S cities ranked: Increase in tourism sentiment
It’s clear that the volume of conversations about these cities is increasing, but how is perception changing? To find out, we measure each destination’s Tourism Sentiment Score™. This expresses a destination’s ability to generate positive word of mouth on a scale from -100 to +100.
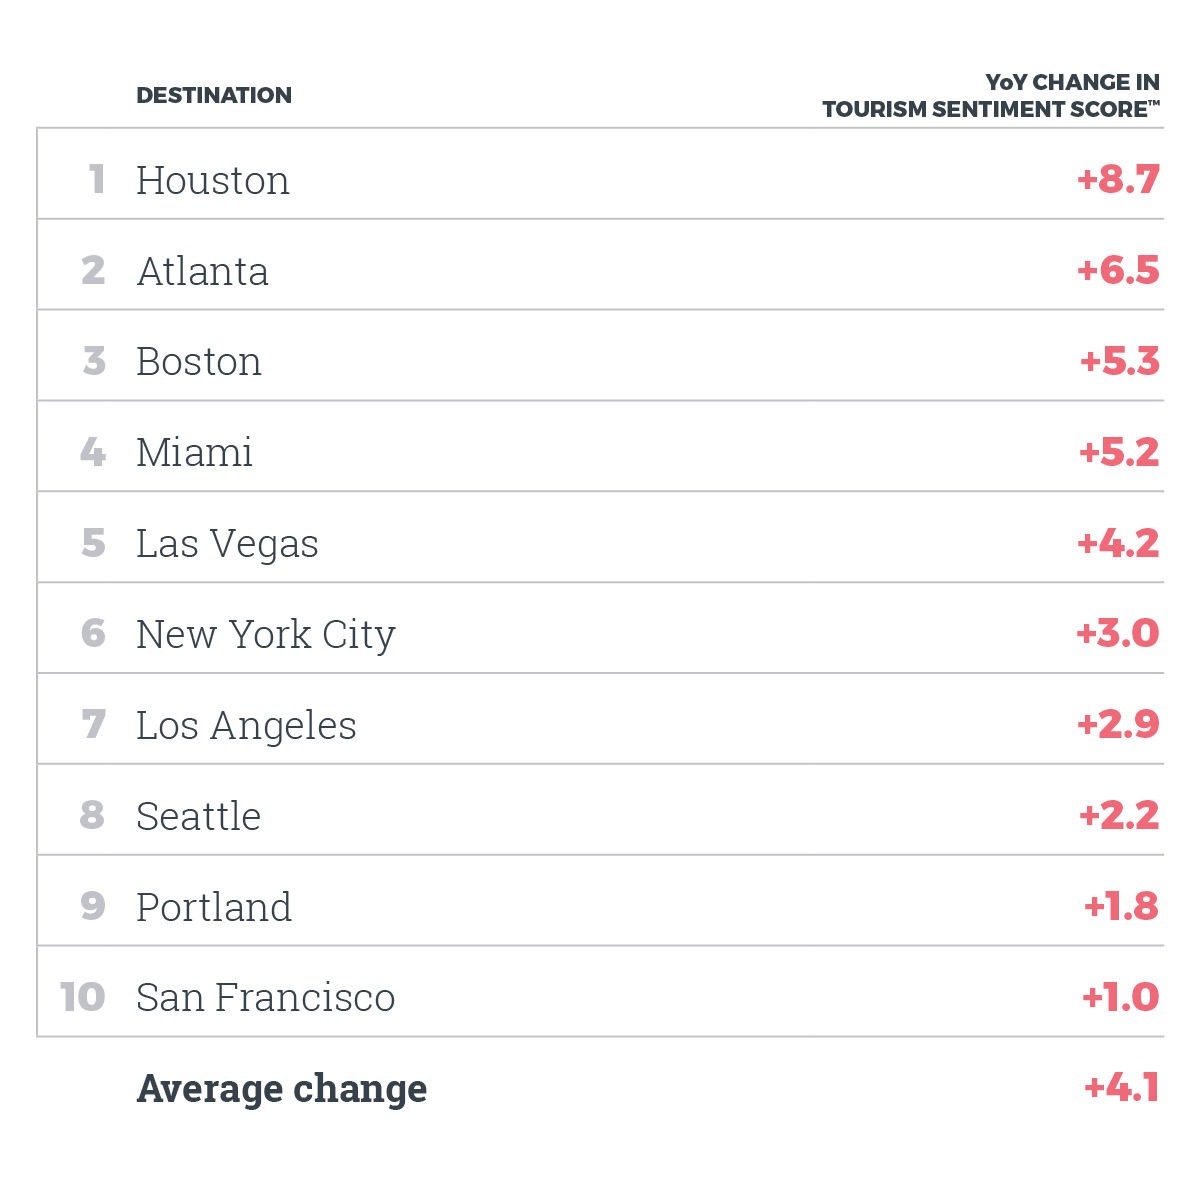 The table above ranks the 10 cities according to changes in their Tourism Sentiment Score™. Want to know how it works? Find out what goes into each Tourism Sentiment Score™ and why this KPI is critical to understanding your destination’s performance.
Quantity does not equal quality. When we measure by sentiment, the 10 cities rank differently with Houston emerging on top. It is important to note, though, that perception of tourism has moved upward across all 10 places.
Curious about your destination’s Tourism Sentiment Score™? Click to schedule a 15-minute presentation with our TSI team.
What’s behind the positive change in sentiment?
These tourism assets had the highest increases in sentiment among the top three cities.
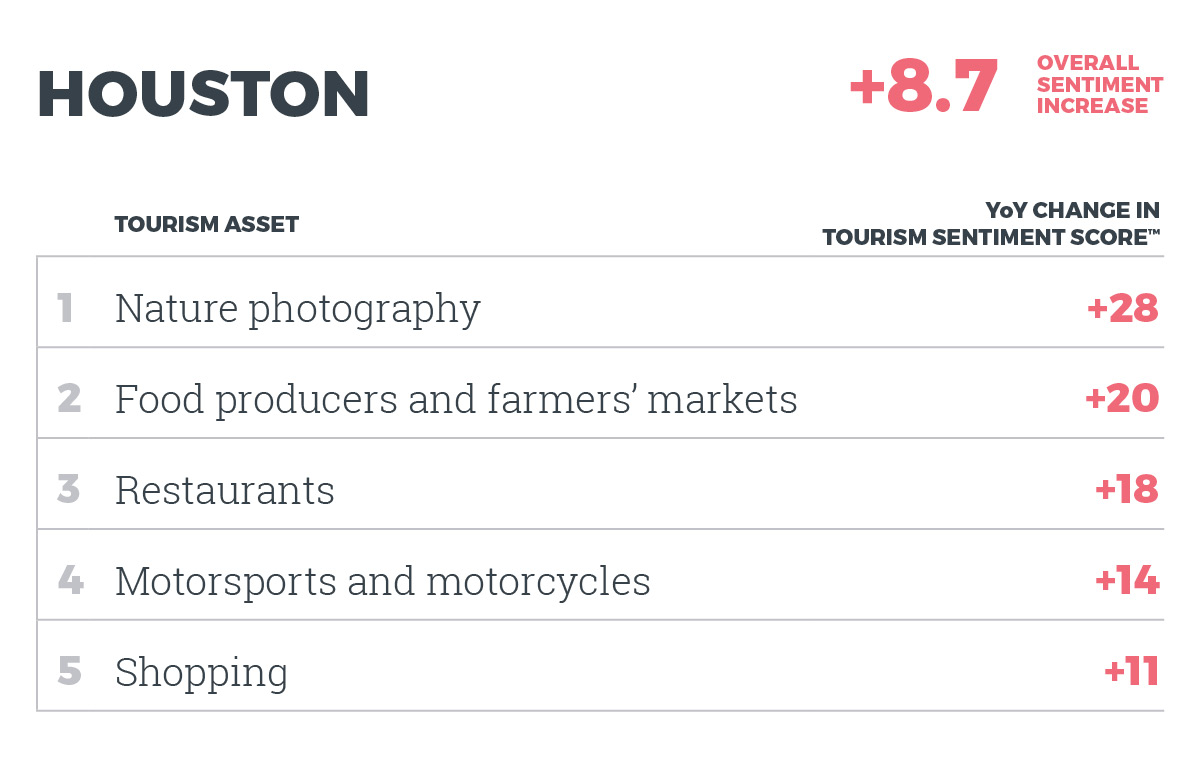
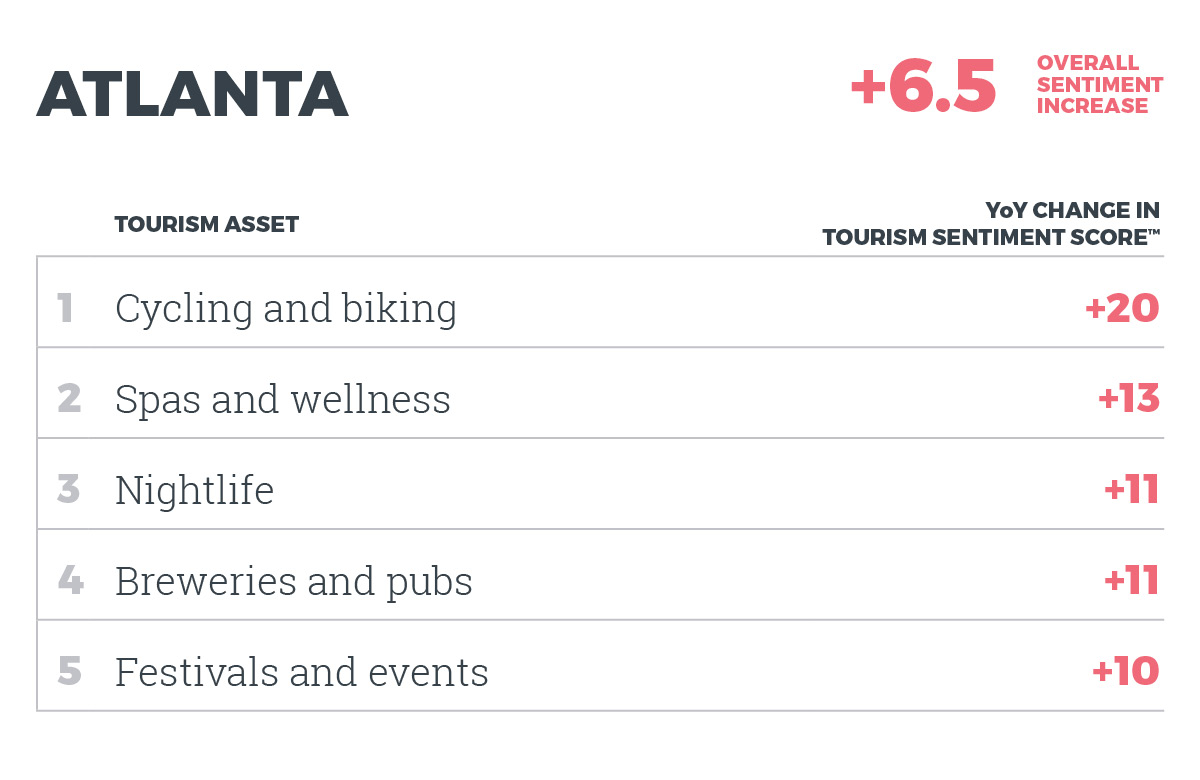
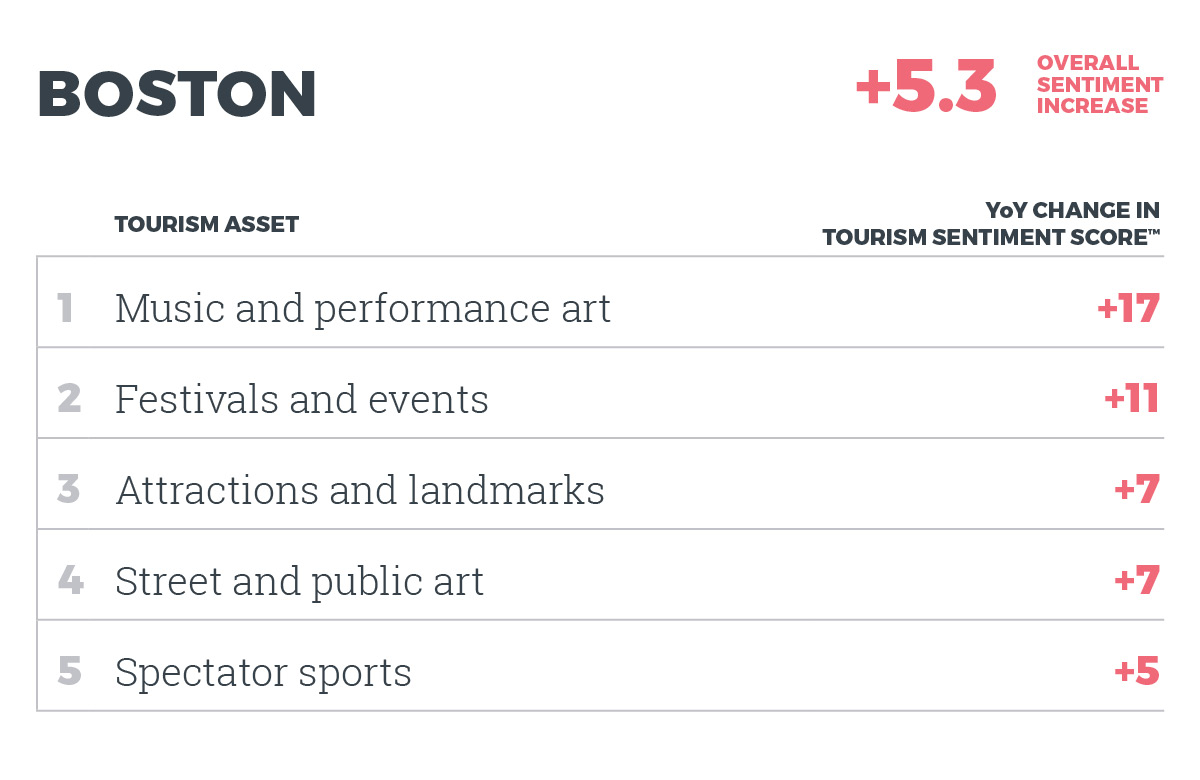 The results show a fascinating variety of high-performing assets. Each city has a distinct blend of strengths and weaknesses that are easy to identify with the data that TSI provides. When measured year-over-year, the report gives participating destinations a benchmark that lets them see, at a glance, how they are performing.
Click to schedule a 15-minute presentation with our TSI team. Availability is limited.
Takeaways from the data
What does this data tell us about these 10 cities?
- Tourism conversation volume is skyrocketing. Though a 40% increase seems enormous, the result wasn’t a shock to our TSI team. Visitors continue to integrate their travel habits with the technology they use to dream about, plan, book, experience and share their trips. Online word of mouth influences every stage of the customer journey. We often see high growth rates associated with the network effects of social media.
- Conversation quantity does not necessarily equal quality. The top cities by volume are different than the top cities by sentiment. To fully understand your destination’s performance, you need to know both.
- Each destination’s performance is determined by a distinct blend of tourism assets. To act on the best opportunities for your destination, you’ll need to be able to show how specific tourism offerings perform.
What Tourism Sentiment Index can do for you
As more word of mouth moves online, you’ll need a way to understand how people feel about your destination at scale.
We’ve focused on U.S. cities here, but TSI is applicable to destinations of almost any size, from small towns to states and provinces or countries.
Some of the most common ways destination marketers use TSI are to:
- Inform strategic decision making with a KPI that measures the destination’s performance over time. You’ll get indisputable data to back your anecdotal evidence.
“The data validates our strategic direction and clarifies true opportunities for our destination.”
Read more: TSI gives destinations an unbiased look in the mirror - Align stakeholders and prove the organization’s value to industry and government. Lead your destination’s internal and external stakeholders with clear, actionable data.
“These insights allow us to better tell our story to our stakeholders.”
Interview: Leading and aligning your stakeholders - Secure DMO funding. Use the data to prove why and where you need additional funding.
“This provided immensely valuable data, which I’ll use to create a business case for funding.” - Celebrate success. Unite your organization and your destination behind good-news stories.
“The entire team is very proud of what we have accomplished, and I am certain that your [TSI] report helped consolidate our leadership in the region.”
Read more stories from destination marketing leaders who use TSI: 5 ways your DMO can re-energize stakeholders with Tourism Sentiment Index
How does Tourism Sentiment Index work?
TSI scans the internet for all online conversation about your destination. TSI analysts then spend four to six weeks distilling your data into a simple and actionable report. The report will break down and score the sentiment people share about your destination online across six tourism categories and 50 tourism assets.
The report provides a distinct competitive advantage. Each report includes data about one destination – yours – and five competitors selected for comparison.
Don’t just keep up with the global conversation, stay ahead of it
Update, July 2 2019: TSI reports are limited in availability. There has been a rapid uptake of TSI over the last 12 months. To ensure we continue to deliver the utmost quality and support, we are limiting the number of reports we provide in 2019 after 200 destinations join the program. We are nearly sold out.


0 Comments